 نمایش بزرگتر
Pico2207A
کد کالا: 4426
استفاده شده
دستهبندی: اسیلوسکوپ بالای 50 تا 100 مگا هرتز
موجودی: این محصول در انبار موجود نیست
ویژگی های: Pico2207A
مشخصات کلی
مشخصات حافظه
اینترفیس
مشخصات فیزیکی
مشخصات دستگاه
سایر مشخصات محصول
اطلاعات بیشتر
این سیلوسکوپ دارای دقت 8 بیت است.
از ویژگیهای این سری اسیلوسکوپ ها که آنها را از سایر اسکوپ های اکسترنال USB دار مجزا می کند عبارت است از :
1- این سیلوسکوپ ها به نرم افزار MathLab و excel به صورت آنلاین وصل می شوند.
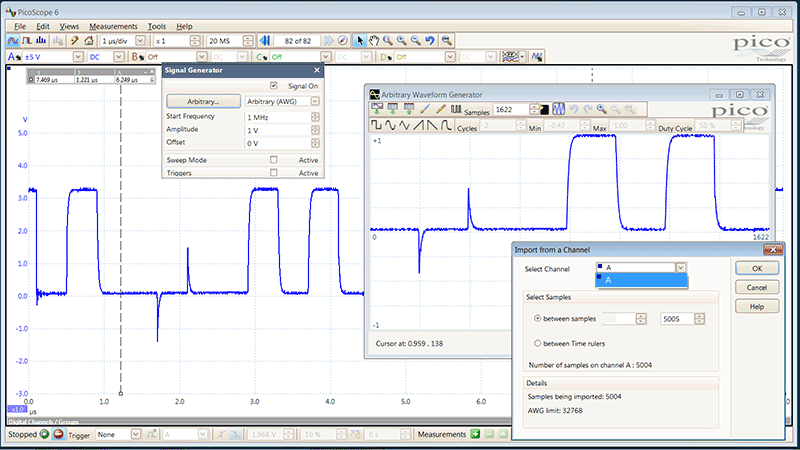
2- این سیلوسکوپ ها دارای یک خروجی سیگنال ژنراتور با قابلیت تولید شکل موج دلخواه (ُ Arbitrary Wave form Generator ) نیز سیگنال می باشند.
توضیحات بیشتر این اسیلوسکوپ در زیر آمده است:
Serial bus decoding and protocol analysis
PicoScope can decode 1-Wire, ARINC 429, CAN, DCC, DMX512, Ethernet 10Base-T and 100Base-TX, FlexRay, I²C, I²S, LIN, PS/2, SENT, SPI, UART (RS-232 / RS-422 / RS-485), and USB protocol data as standard, with more protocols in development, and available in the future with free-of-charge software upgrades.
In graph format shows the decoded data (in hex, binary, decimal or ASCII) in a data bus timing format, beneath the waveform on a common time axis, with error frames marked in red. These frames can be zoomed to investigate noise or signal integrity issues.
In table format shows a list of the decoded frames, including the data and all flags and identifiers. You can set up filtering conditions to display only the frames you are interested in or search for frames with specified properties. The statistics option reveals more detail about the physical layer such as frame times and voltage levels. PicoScope can also import a spreadsheet to decode the data into user-defined text strings.

Arbitrary waveform and function generator
All PicoScope 2000 units have a built-in function generator (sine, square, triangle, DC level, white noise, PRBS etc.) on the front panel. PicoScope 2000 MSO models have the connector on the rear panel.
As well as basic controls to set level, offset and frequency, more advanced controls allow you to sweep over a range of frequencies. Combined with the spectrum peak hold option this makes a powerful tool for testing amplifier and filter responses.
Trigger tools allow one or more cycles of a waveform to be output when various conditions are met such as the scope triggering or a mask limit test failing.
A 12 bit 20 MS/s arbitrary waveform generator (AWG) is also included. AWG waveforms can be created or edited using the built-in AWG editor, imported from oscilloscope traces, or loaded from a spreadsheet.

FFT spectrum analyzer
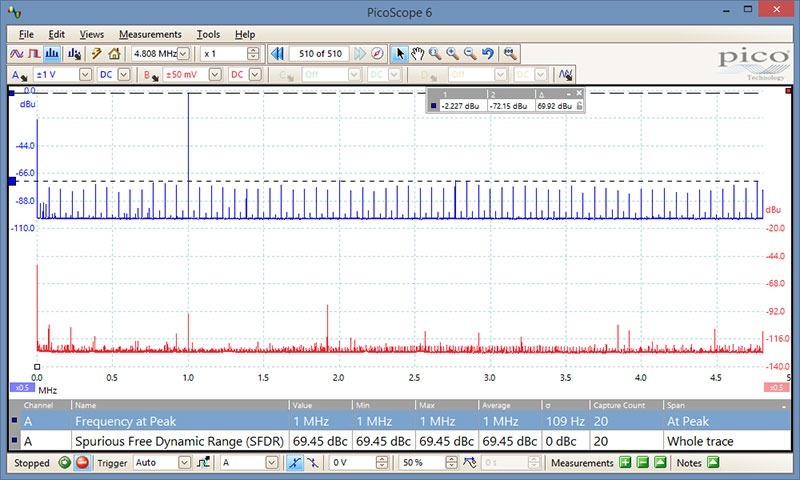
The spectrum view plots amplitude vs frequency and is ideal for finding noise, crosstalk or distortion in signals. The spectrum analyzer in PicoScope is of the Fast Fourier Transform (FFT) type which, unlike a traditional swept spectrum analyzer, can display the spectrum of a single, non-repeating waveform.
A full range of settings gives you control over the number of spectrum bands (FFT bins), window types, scaling (including log/log) and display modes (instantaneous, average, or peak-hold).
You can display multiple spectrum views alongside oscilloscope views of the same data. A comprehensive set of automatic frequency-domain measurements can be added to the display, including THD, THD+N, SNR, SINAD and IMD. A mask limit test can be applied to a spectrum and you can even use the AWG and spectrum mode together to perform swept scalar network analysis.
Signal integrity
Most oscilloscopes are built down to a price. PicoScopes are built up to a specification.
Careful front-end design and shielding reduces noise, crosstalk and harmonic distortion. Years of oscilloscope design experience can be seen in improved bandwidth flatness and low distortion.
We are proud of the dynamic performance of our products, and unlike most oscilloscope manufacturers publish their specifications in detail. The result is simple: when you probe a circuit, you can trust in the waveform you see on the screen.
USB connectivity
The USB connection not only allows high-speed data acquisition and transfer, but also makes printing, copying, saving, and emailing your data from the field quick and easy. USB powering removes the need to carry around a bulky external power supply, making the kit even more portable for the engineer on the move.
PicoScope 2000 Series oscilloscopes feature a USB 2.0 connection.

@COMMENT_TITLE@
@COMMENT_COMMENT@